

Introduction
Monitoring Events Per Second (EPS) and log storage usage in Wazuh is essential for maintaining system performance, storage efficiency, and capacity planning.
A high EPS means your system is processing a large volume of logs, which can impact:
- Performance – More logs require more processing power and memory.
- Storage Costs – Storing unnecessary logs increases disk space usage.
- Query Speed – Too many logs can slow down threat detection queries.
This step-by-step guide will show you how to:
✔ Calculate EPS in Wazuh
✔ Check log storage usage
✔ Optimize Wazuh for performance and scalability
Step 1: Understanding EPS in Wazuh
What is EPS (Events Per Second)?
EPS measures how many security events (logs) Wazuh processes per second.
📌 Why is EPS important?
- Helps plan for hardware requirements based on log volume.
- Ensures Wazuh can handle peak log traffic without performance issues.
- Helps optimize storage retention policies to save disk space.
Step 2: Finding EPS in Wazuh
How Wazuh Stores Logs
Wazuh stores security logs (alerts) in an Elasticsearch index, named wazuh-alerts-*.
- Each day, Wazuh creates a new index (e.g.,
wazuh-alerts-2024.10.28). - Logs are stored with a timestamp to track when events happened.
Querying Wazuh for Total Events (Alert Logs)
To calculate EPS, we count the total number of events over a specific period (e.g., last 30 days).
📌 Run This Query in Wazuh Dev Tools
For this lab environment, we have used Wazuh Version 4.5 which was used as a plugin for elasticsearch version 7.17.13
1️⃣ Log in to Wazuh Dashboard
2️⃣ Go to “Dev Tools”
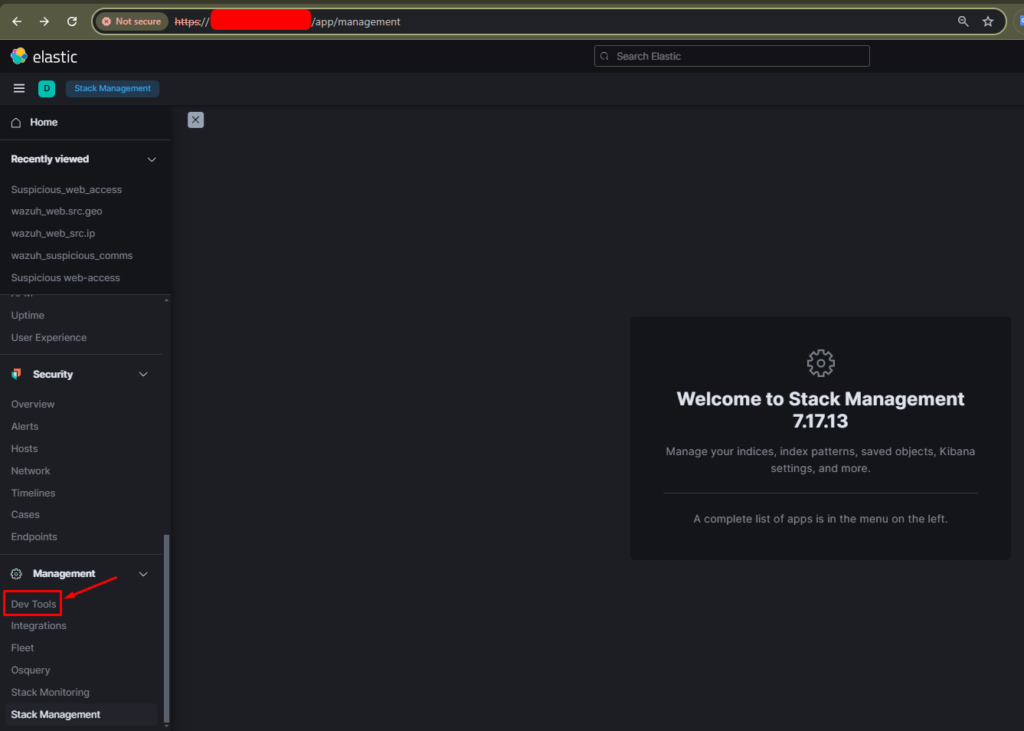
3️⃣ Run the following query:
GET wazuh-alerts-*/_count
{
  "query": {
    "range": {
      "@timestamp": {
        "gte": "now-30d",
        "lt": "now"
      }
    }
  }
}

🔎 Understanding the Query
| Query Component | Purpose |
|---|---|
GET wazuh-alerts-*/_count | Retrieves the total number of evnts (alerts) stored in Wazuh. |
"range": { "@timestamp": { "gte": "now-30d", "lt": "now" }} | Filters logs from the last 30 days. |
wazuh-alerts-* | Ensures logs are counted from all alert indices. |
✅ Example Output:
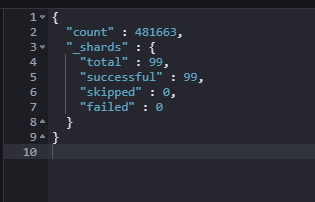
📝 This means Wazuh processed 481,663 events (alert logs) in the last 30 days.
Step 3: Calculating EPS in Wazuh
📌 EPS Formula:
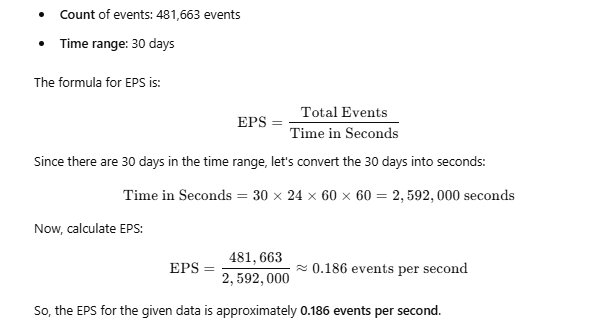
✅ Your Wazuh instance is processing ~0.186 events per second.
Step 4: Checking Log Storage in Wazuh
To ensure your system has enough disk space, check how much storage Wazuh logs are using.
📌 Run This Query to Check Storage Usage
GET _cat/indices/wazuh-alerts-*?bytes=b&h=index,docs.count,store.size
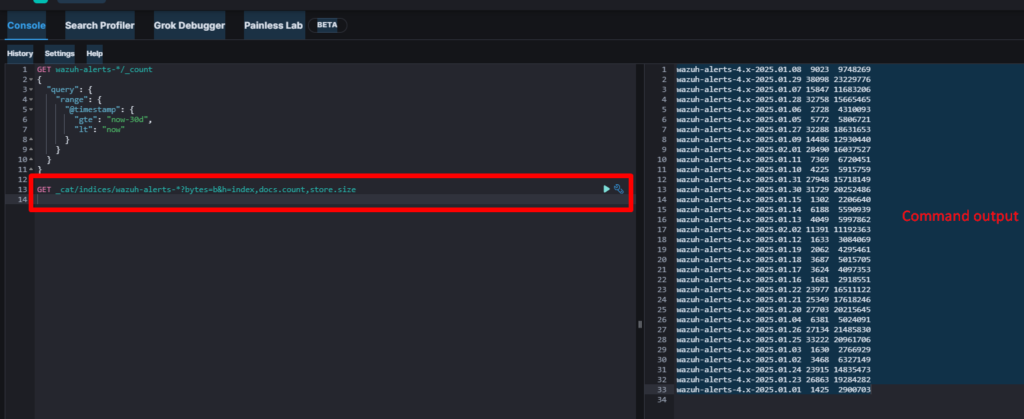
Here is the table format for the output data:
| Log File Name | Log Count | Storage in Bytes |
|---|---|---|
| wazuh-alerts-4.x-2025.01.08 | 9,023 | 9,748,269 |
| wazuh-alerts-4.x-2025.01.29 | 38,098 | 23,229,776 |
| wazuh-alerts-4.x-2025.01.07 | 15,847 | 11,683,206 |
| wazuh-alerts-4.x-2025.01.28 | 32,758 | 15,665,465 |
| wazuh-alerts-4.x-2025.01.06 | 2,728 | 4,310,093 |
| wazuh-alerts-4.x-2025.01.05 | 5,772 | 5,806,721 |
| wazuh-alerts-4.x-2025.01.27 | 32,288 | 18,631,653 |
| wazuh-alerts-4.x-2025.01.09 | 14,486 | 12,930,440 |
| wazuh-alerts-4.x-2025.02.01 | 28,490 | 16,037,527 |
| wazuh-alerts-4.x-2025.01.11 | 7,369 | 6,720,451 |
| wazuh-alerts-4.x-2025.01.10 | 4,225 | 5,915,759 |
| wazuh-alerts-4.x-2025.01.31 | 27,948 | 15,718,149 |
| wazuh-alerts-4.x-2025.01.30 | 31,729 | 20,252,486 |
| wazuh-alerts-4.x-2025.01.15 | 1,302 | 2,206,640 |
| wazuh-alerts-4.x-2025.01.14 | 6,188 | 5,590,939 |
| wazuh-alerts-4.x-2025.01.13 | 4,049 | 5,997,862 |
| wazuh-alerts-4.x-2025.02.02 | 11,391 | 11,192,363 |
| wazuh-alerts-4.x-2025.01.12 | 1,633 | 3,084,069 |
| wazuh-alerts-4.x-2025.01.19 | 2,062 | 4,295,461 |
| wazuh-alerts-4.x-2025.01.18 | 3,687 | 5,015,705 |
| wazuh-alerts-4.x-2025.01.17 | 3,624 | 4,097,353 |
| wazuh-alerts-4.x-2025.01.16 | 1,681 | 2,918,551 |
| wazuh-alerts-4.x-2025.01.22 | 23,977 | 16,511,122 |
| wazuh-alerts-4.x-2025.01.21 | 25,349 | 17,618,246 |
| wazuh-alerts-4.x-2025.01.20 | 27,703 | 20,215,645 |
| wazuh-alerts-4.x-2025.01.04 | 6,381 | 5,024,091 |
| wazuh-alerts-4.x-2025.01.26 | 27,134 | 21,485,830 |
| wazuh-alerts-4.x-2025.01.25 | 33,222 | 20,961,706 |
| wazuh-alerts-4.x-2025.01.03 | 1,630 | 2,766,929 |
| wazuh-alerts-4.x-2025.01.02 | 3,468 | 6,327,149 |
| wazuh-alerts-4.x-2025.01.24 | 23,915 | 14,835,473 |
| wazuh-alerts-4.x-2025.01.23 | 26,863 | 19,284,282 |
| wazuh-alerts-4.x-2025.01.01 | 1,425 | 2,900,703 |
4.1: Total Storage Calculation in Bytes
To calculate the total storage, first, we need to add up the storage values for each log file in bytes. This gives us the total storage used for all logs over 30 days.
Here’s the storage in bytes for each log:
wazuh-alerts-4.x-2025.01.08: 9,748,269 byteswazuh-alerts-4.x-2025.01.29: 23,229,776 byteswazuh-alerts-4.x-2025.01.07: 11,683,206 byteswazuh-alerts-4.x-2025.01.28: 15,665,465 byteswazuh-alerts-4.x-2025.01.06: 4,310,093 bytes- … (and the same for the remaining logs)
Sum of all the log storage
Total Storage=9,748,269+23,229,776+11,683,206+…+2,900,703=358,980,114bytes
So, the total storage used by all logs over 30 days is 358,980,114 bytes.
4.2: Convert Total Storage to MB and GB
Now, let’s convert the total storage from bytes to MB and GB.
- 1 MB = 1,048,576 bytes
- 1 GB = 1,073,741,824 bytes
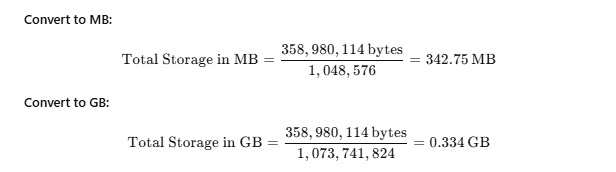
So, the total storage used is 342.75 MB (or 0.334 GB).
4.3: Average Storage per Day Calculation
Next, to find the average storage used per day, we divide the total storage by the number of days (30 days):
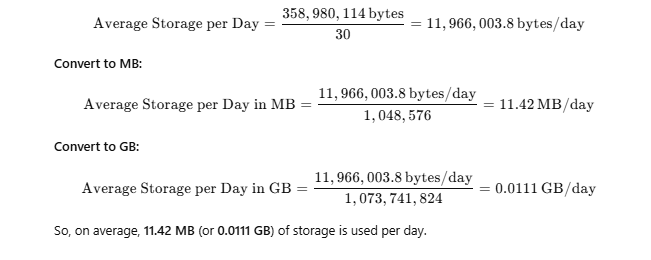
So, on average, 11.42 MB (or 0.0111 GB) of storage is used per day.
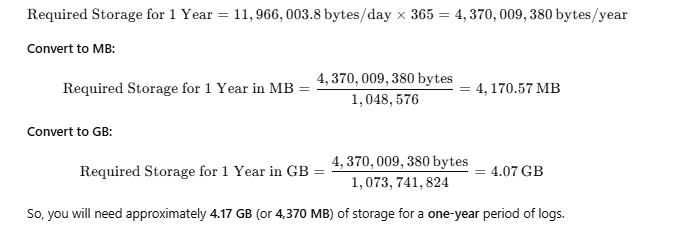
4.4: Required Storage for 1 Year
To estimate how much storage will be required for one year of log data, we multiply the average storage per day by 365 (the number of days in a year):
4.5: Retention Period for Available Storage
Lastly, let’s calculate how long 100 GB of storage will last with the current log data rate. First, convert 100 GB to bytes:

This means that 100 GB of storage will last for approximately 9 days at the current log data rate.
Summary of Results:
- Total Storage (for 30 days): 342.75 MB (or 0.334 GB)
- Average Storage per Day: 11.42 MB (or 0.0111 GB)
- Required Storage for 1 Year: 4.17 GB
- Retention Period for 100 GB: Approximately 9 days
This step-by-step calculation shows you how to calculate the storage used by Wazuh logs and how to project future storage requirements.
Step 5: Optimizing EPS and Storage in Wazuh
To prevent performance slowdowns and high storage costs, follow these best practices:
🔹 Reduce EPS and Disk Usage
✅ Enable Log Rotation
- Automatically delete old logs using Index Lifecycle Management (ILM).
✅ Use Retention Policies
- Set a policy to keep logs for X days and delete/archive older logs.
✅ Filter Non-Essential Logs
- Exclude low-priority logs from being indexed.
✅ Optimize Wazuh Indexing
- Use efficient mappings to reduce disk usage.
✅ Archive Historical Logs
- Store older logs on external storage (e.g., AWS S3, Azure Blob).
Final Thoughts
✅ What You Learned Today:
✔ How to calculate EPS in Wazuh.
✔ How to check log storage usage.
✔ How to optimize Wazuh for better performance.
Hello!
Thanks a lot for this amazing article. It helped a lot estimating our Wazuh size!
I have one idea for improvement:
Please have in mind, that running a Wazuh instance as cluster covers redundant data storage. I think this should be considered when calculating future log size requirements.
And I have one request:
Could You please write another article about “Step 5: Optimizing EPS and Storage in Wazuh”? I think Your 5 ideas can help a lot building a robust and lasting Wazuh instance … but unfortunately Wazuh documentation does not help a lot at these topics.
Thanks a lot!
BR Stefan
Hi Stefan, Thanks for your comment and concern also. You also can share your write-ups here.